


Have you ever been in a plane that keeps circling around, waiting to land? That’s what the stock market feels like right now. Investors are rotating from one sector to another, waiting for direction from the control tower.
How Does an Investor Get Direction?
There are many tools out there, but one tool that gives you a quick aerial view of the entire stock market is the MarketCarpets from StockCharts.
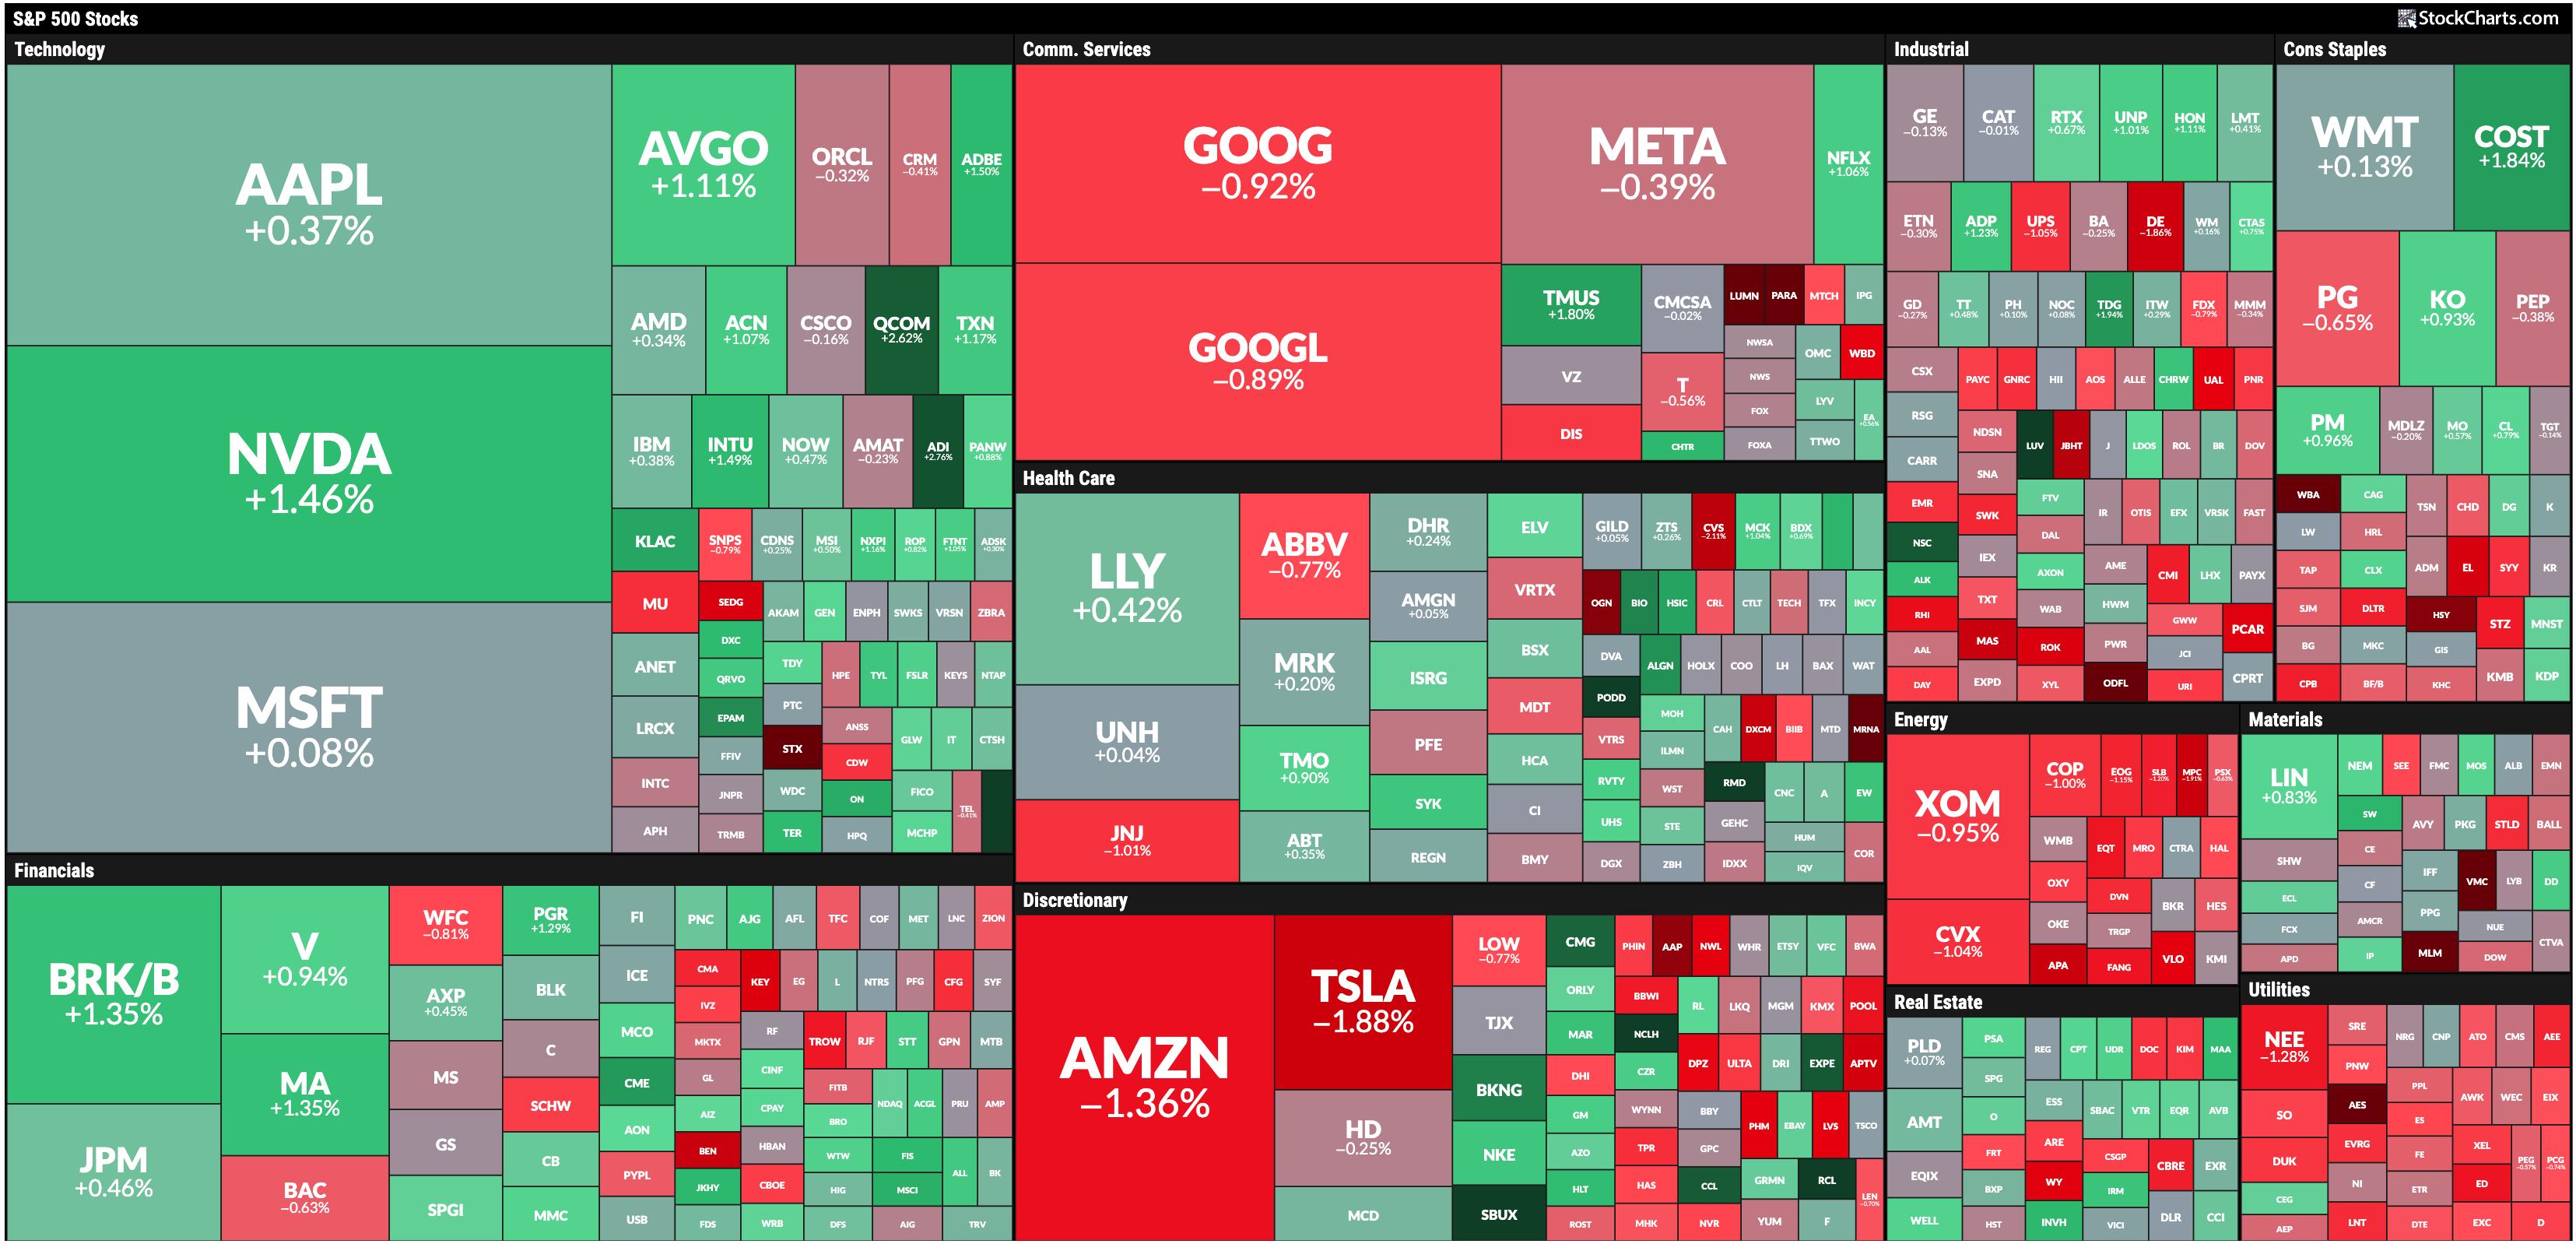
FIGURE 1. THE STOCKCHARTS MARKETCARPETS. In one glance you can identify the strongest and weakest sectors.Image source: StockCharts.com. For educational purposes.
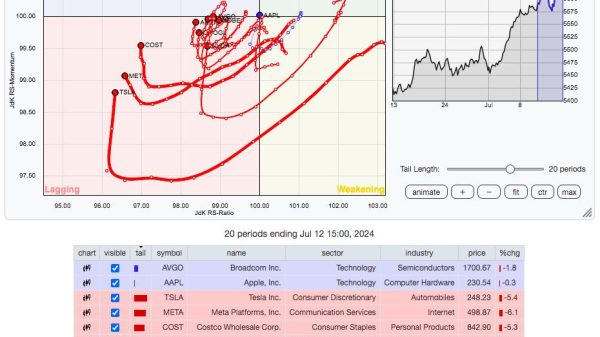
Looking at the one-day change performance of the S&P 500, there’s mixed activity in equity trading. Technology is the leading sector, followed by Financials. Energy, and Utilities are the laggards.

One factor you can see right away is the mixed activity in the Mag 7 stocks. Nvidia (NVDA) is in the spotlight, since it could provide direction this week—it’s reporting quarterly earnings on Wednesday after the close. The stock was up 1.46% on Tuesday. Apple (AAPL) increased slightly, and Microsoft (MSFT) even less. Amazon.com (AMZN), Tesla (TSLA), Alphabet (GOOGL), and Meta Platforms (META) closed lower.
It’ll be interesting to see how much NVDA’s stock price moves after it reports earnings. Will it still have the impact it did before the stock price pulled back? We’ll have to wait until Wednesday’s after-hours market activity and see how much higher the stock price moves if the earnings report is positive, or how much lower it goes if earnings miss expectations.
With Fed rate cuts on the horizon, investors may rotate out of tech and into financial stocks or other small-cap stocks, especially if NVDA misses. Lower interest rates help financial stocks, so it’s not surprising that Financials took the number two spot.
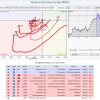
The weekly chart of the Financial Select Sector SPDR Fund (XLF), the StockCharts proxy for the Financial sector, displays a solid upward trend since mid-November. The ETF closed at a new all-time high today (August 27, 2024).
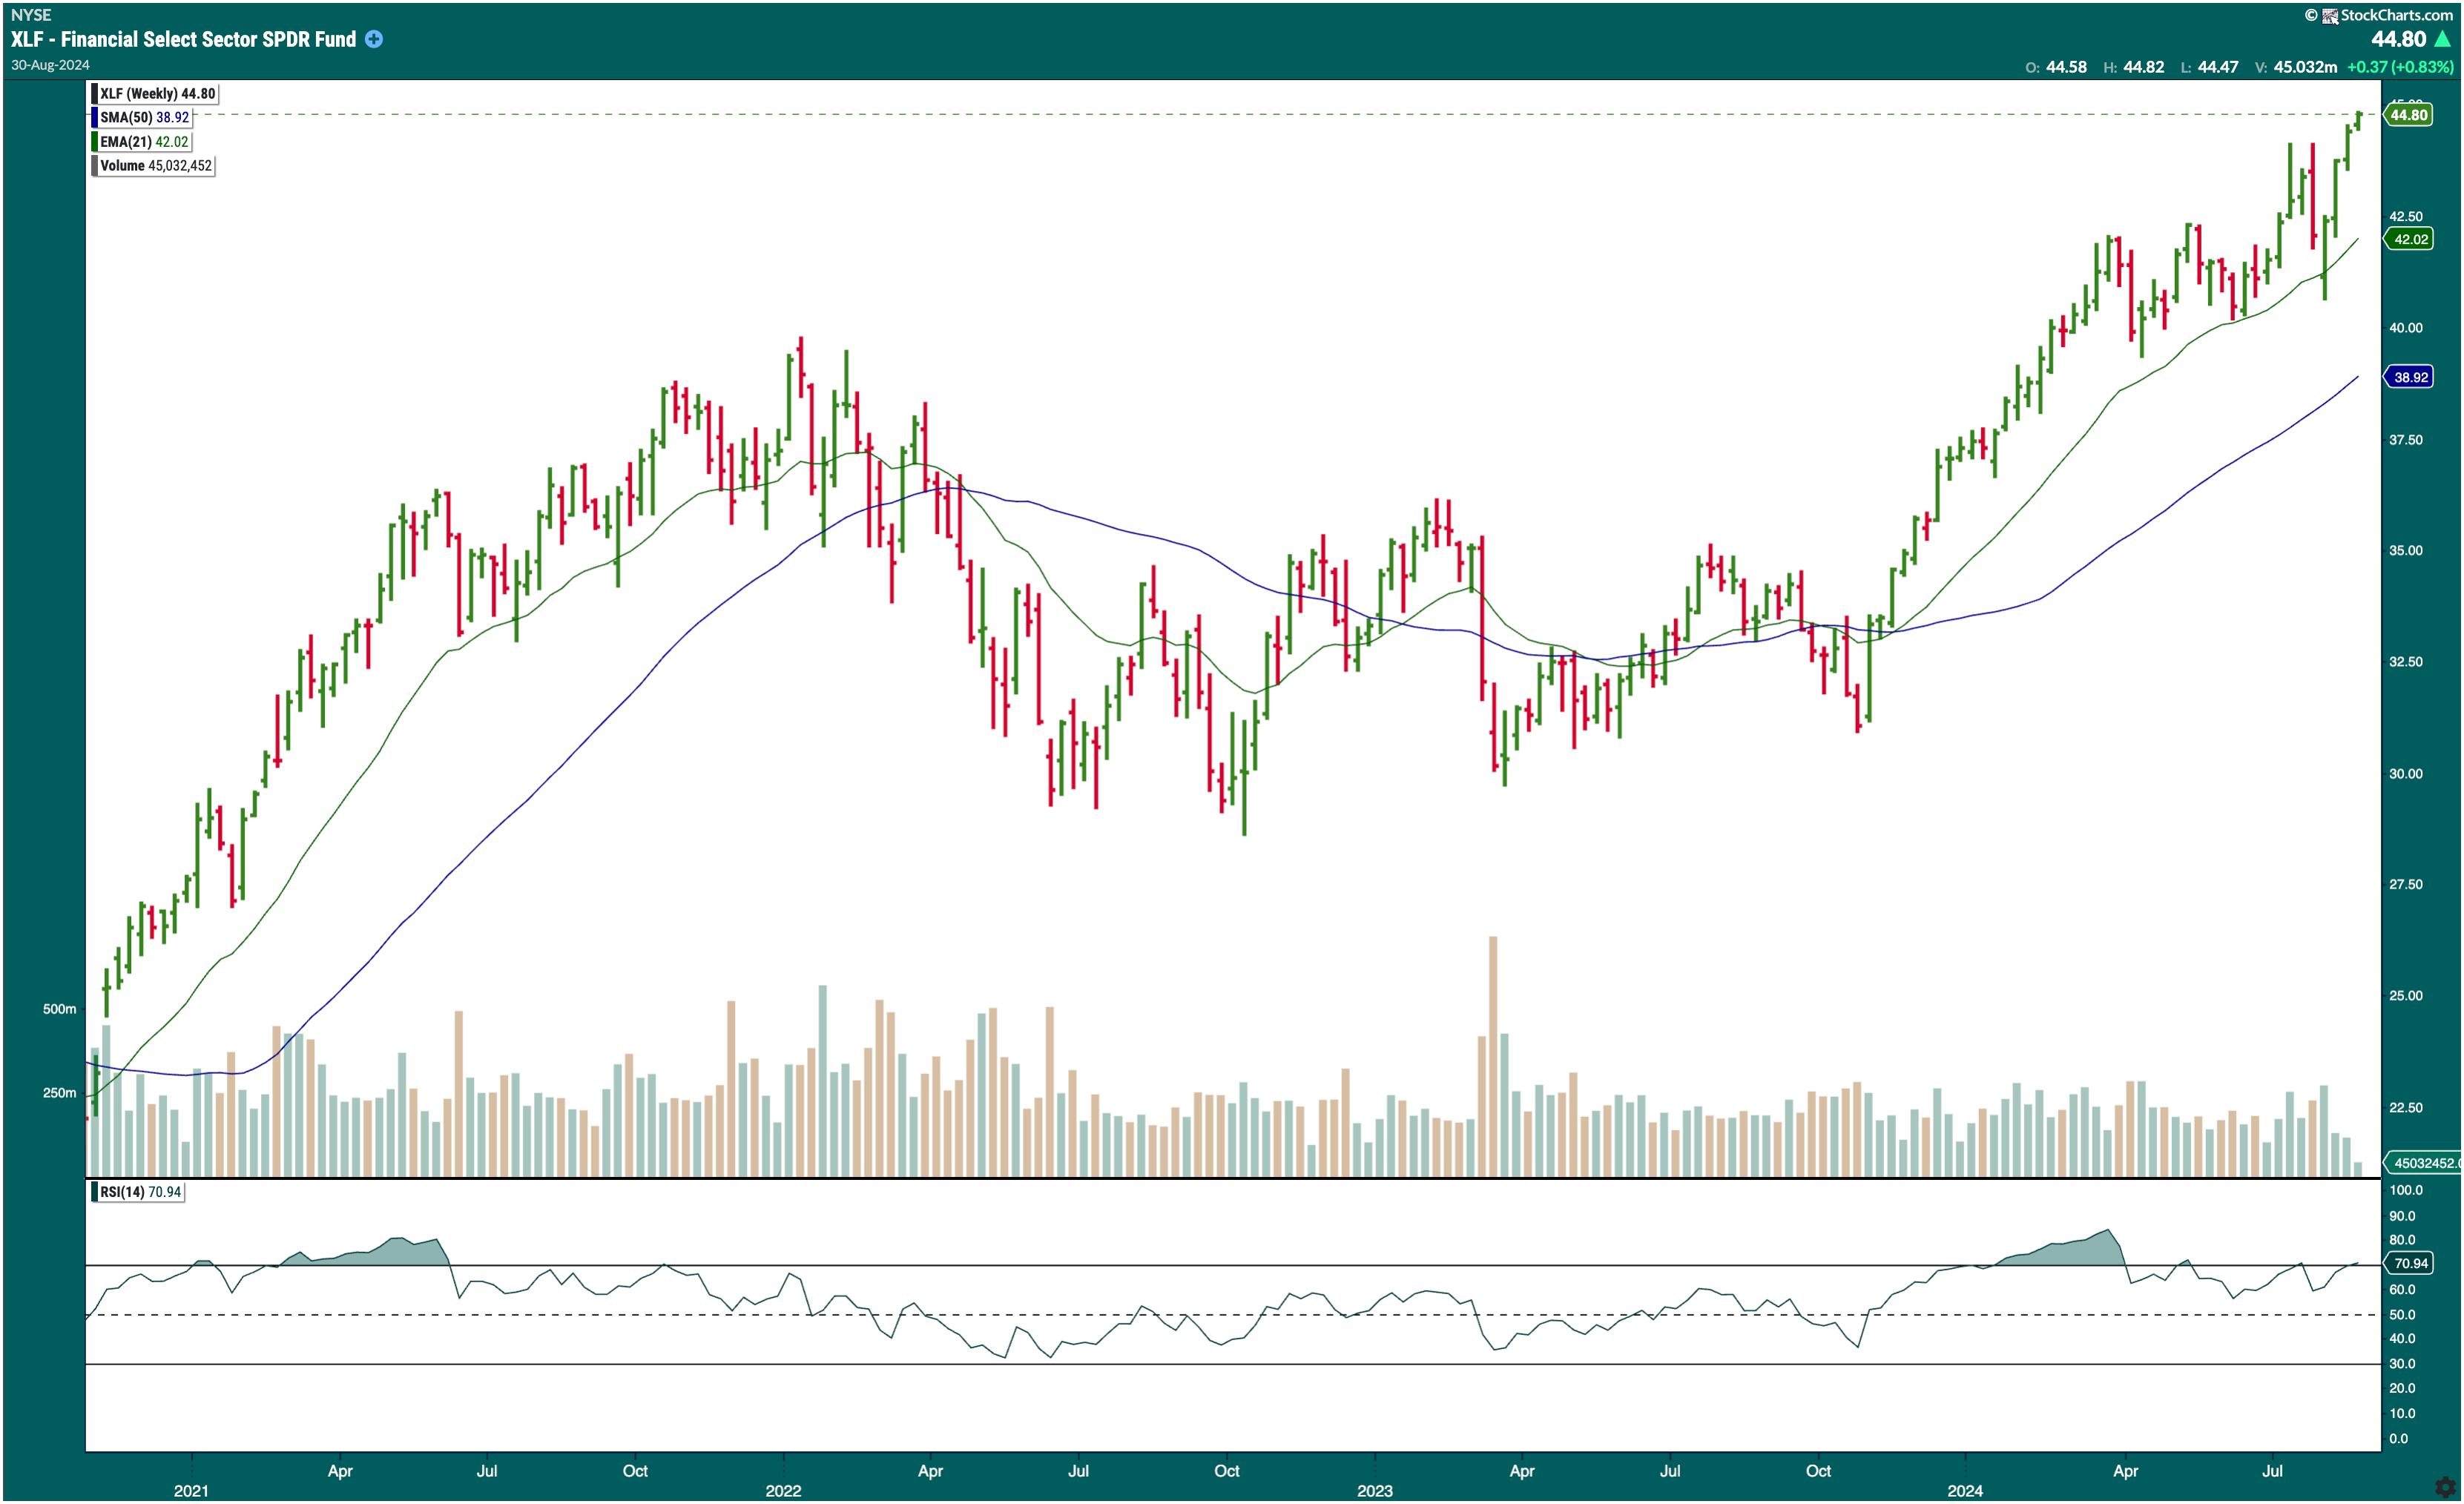
FIGURE 2. XLF HITS ALL-TIME HIGH. The Financial sector has been trending higher, finding support at its 21-week exponential moving average (EMA). The relative strength index (RSI) is just at the overbought level.Chart source: StockChartsACP. For educational purposes.
XLF is trading above its 21-week exponential moving average (EMA), which can be the first support level to watch. With the relative strength index (RSI) at around 70, there’s still room for XLF to go higher. Look at how much the ETF moved the last time it was above 70!
Closing Position
The stock market is dynamic, and one day doesn’t make a trend. Tomorrow could reflect a different story. Tools such as the MarketCarpet can help you become engaged with stock market activity without scrolling through several charts.
Explore the different ways to use the StockCharts MarketCarpets.
Disclaimer: This blog is for educational purposes only and should not be construed as financial advice. The ideas and strategies should never be used without first assessing your own personal and financial situation, or without consulting a financial professional.